Nextflow Pipeline
BayesTME provides an end-to-end pipeline implemented in nextflow for running a basic analysis on a Visium 10x dataset.
The only requirements for running the BayesTME nextflow pipeline locally are to install nextflow (https://www.nextflow.io/docs/latest/getstarted.html) and docker (or singularity).
nextflow run main.nf -profile docker --input <path to spaceranger output or .h5ad file> --n_cell_types 5 --outdir <output dir>
If you are providing a .h5ad file, make sure it has the correct input attributes: Input Format
If you are providing a spaceranger output directory, we will create an AnnData h5ad from it.
The results will be in the outdir directory specified in the params file, and will include
data and plots.
For more complicated workflows, see ./nextflow/modules and ./nextflow/subworkflows for composable components that can be reused to author new pipelines.
Output
When you run this nextflow command, you should see the following output on your terminal:
[18/aedf8d] BAY…UM_ANALYSIS:BAYESTME_LOAD_SPACERANGER (sample) | 1 of 1 ✔
[11/123e74] BAY…VISIUM_ANALYSIS:BAYESTME_FILTER_GENES (sample) | 1 of 1 ✔
[1b/91f87b] BAY…ISIUM_ANALYSIS:BAYESTME_DECONVOLUTION (sample) | 1 of 1 ✔
[c8/49d777] BAY…STME_SPATIAL_TRANSCRIPTIONAL_PROGRAMS (sample) | 1 of 1 ✔

Completed at: 12-Mar-2025 12:41:56
Duration    : 13m 31s
CPU hours   : 0.2
Succeeded   : 4
You can then view the results directory, which will look like this:
.
├── pipeline_info
│ ├── execution_report_2025-03-12_13-24-18.html # report of each step in the pipeline and the RAM/CPU/Time used
│ ├── execution_timeline_2025-03-12_13-24-18.html
│ └── pipeline_dag_2025-03-12_13-24-18.html
├── sample
│ ├── dataset.h5ad # input anndata
│ ├── dataset_deconvolved_marker_genes.h5ad # output anndata
│ ├── dataset_filtered.h5ad # filtered anndata (with genes subsetted)
│ ├── deconvolution_loss.pdf # deconvolution loss plot
│ ├── deconvolution_samples.h5 # deconvolution samples
│ ├── marker_genes.csv # marker gene ranking for all genes in all celltypes
│ ├── omega.csv
│ ├── plots
│ │ ├── cell_num_one_vs_all_scatterpie__Cell Type 0.pdf # one vs all scatterpies
│ │ ├── cell_num_one_vs_all_scatterpie__Cell Type 1.pdf
│ │ ├── cell_num_one_vs_all_scatterpie__Cell Type 2.pdf
│ │ ├── cell_num_one_vs_all_scatterpie__Cell Type 3.pdf
│ │ ├── cell_num_one_vs_all_scatterpie__Cell Type 4.pdf
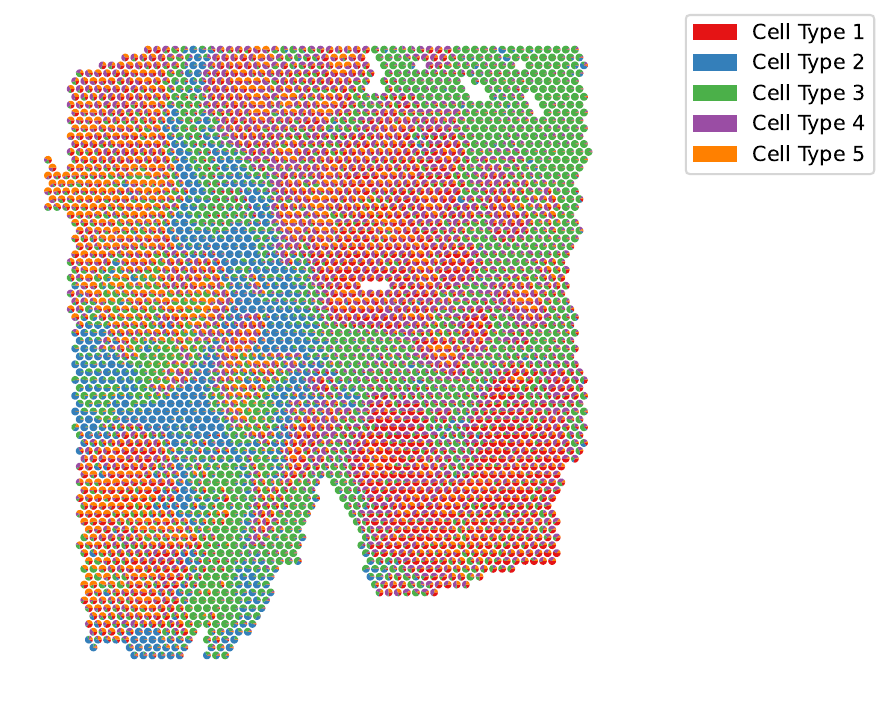
│ │ ├── cell_num_scatterpie.pdf # scatterpie of deconvolved celltype contribution per spot
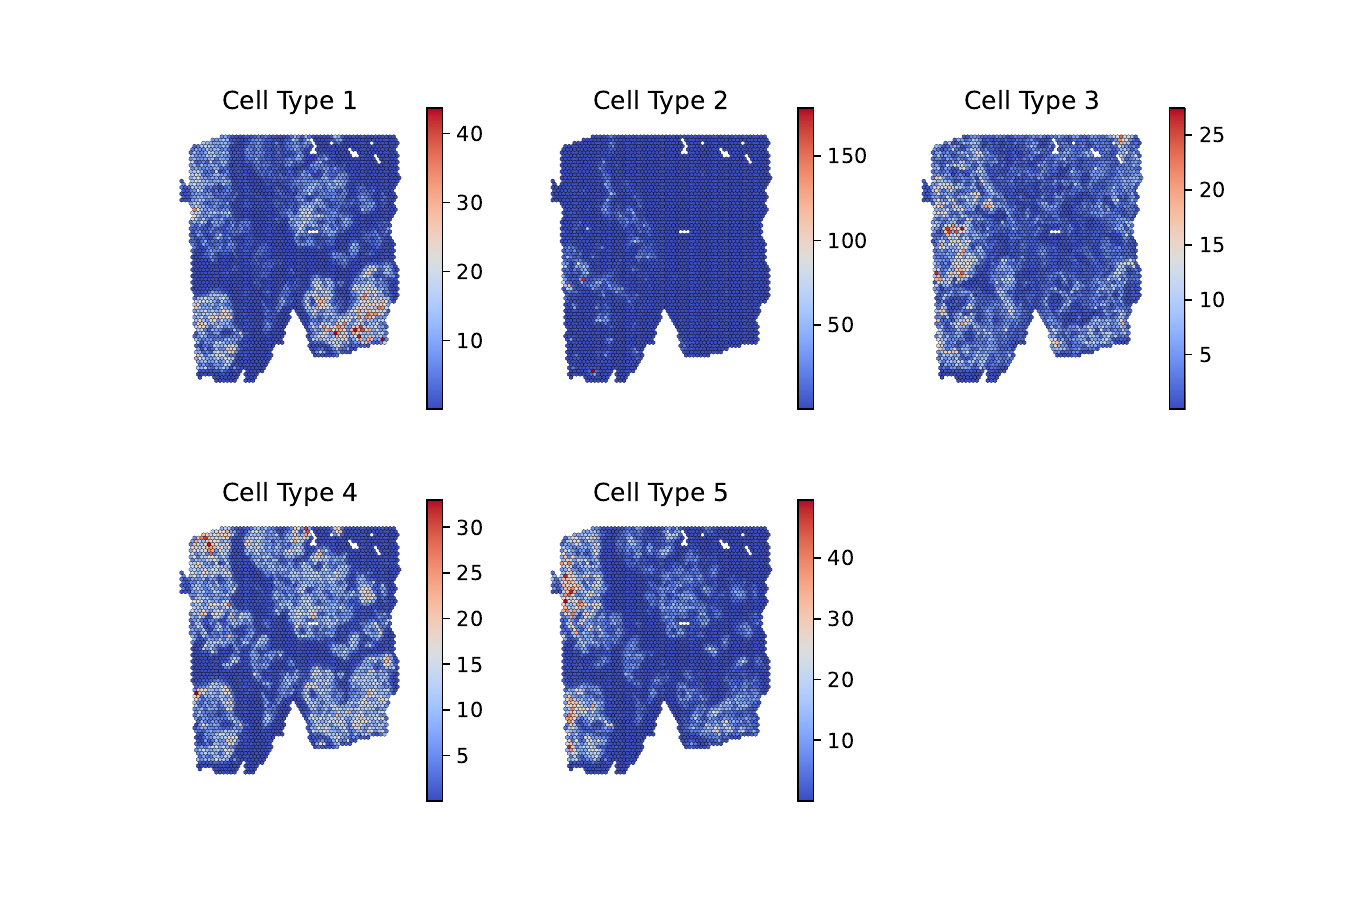
│ │ ├── cell_type_counts.pdf # choropleth of cell type counts
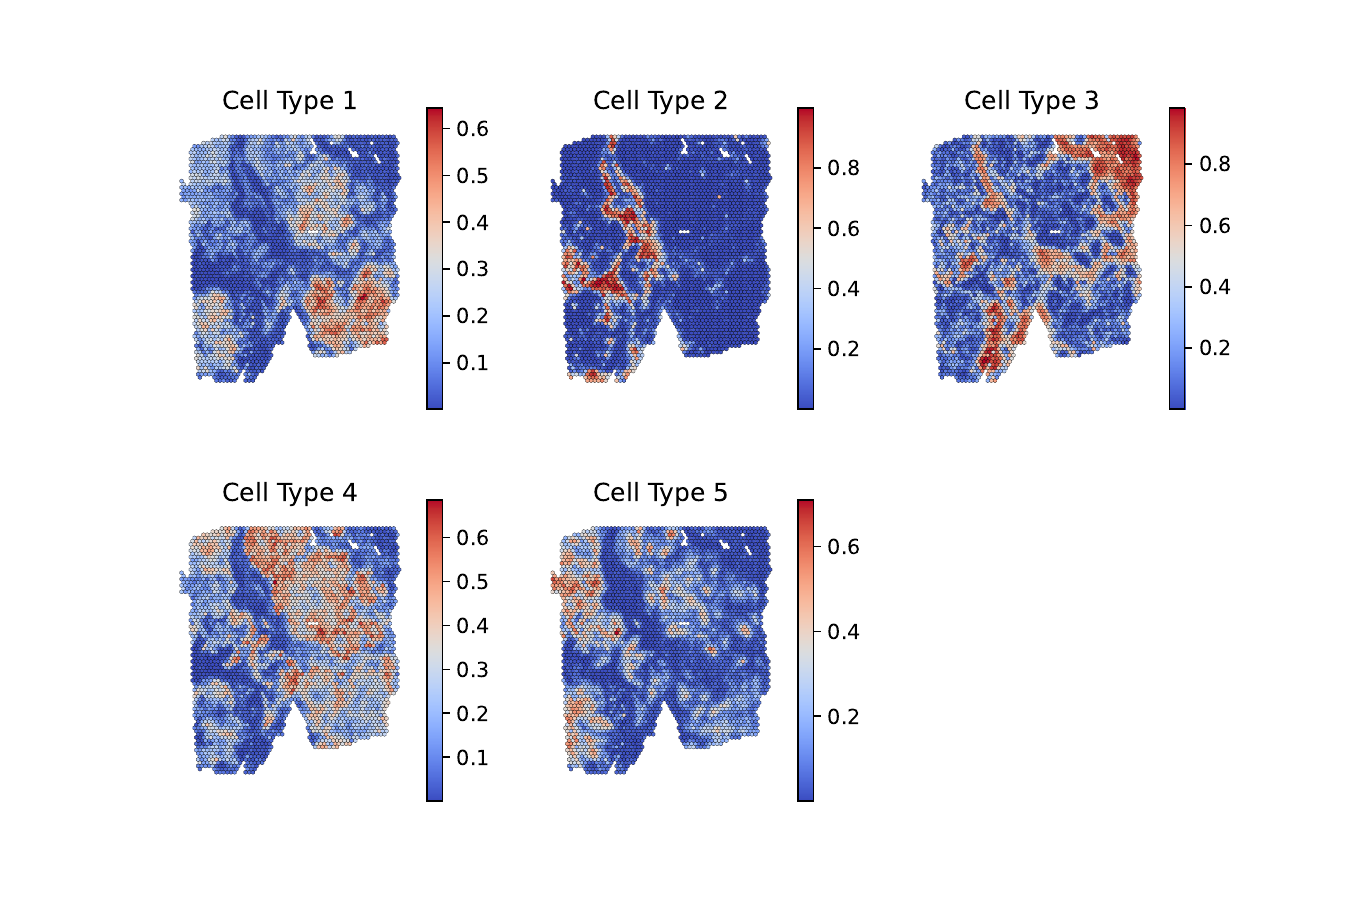
│ │ ├── cell_type_probabilities.pdf # choropleth of cell type probabilities
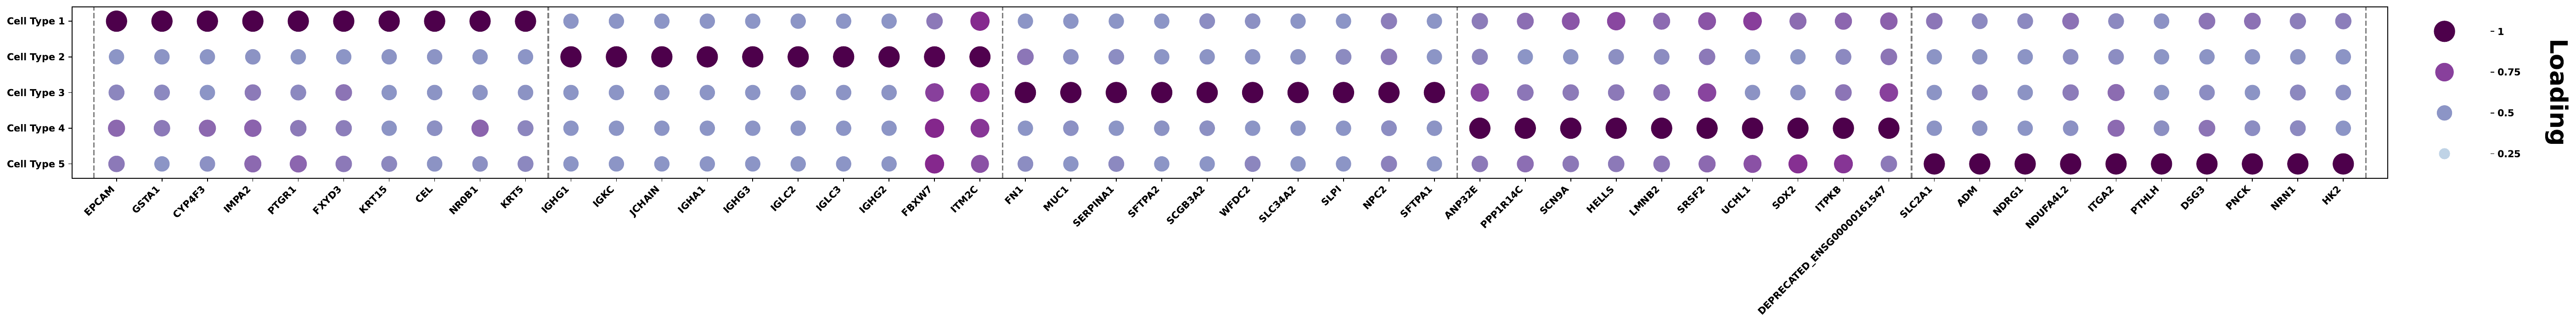
│ │ ├── marker_genes.pdf # marker gene dotplot
│ │ ├── rank_genes_groups.pdf # marker gene rank_genes_groups plot
│ │ └── rank_genes_groups_sharey.pdf
│ ├── relative_expression.csv
│ ├── spatial_transcriptional_programs.h5 # stp samples
│ ├── spot_connectivity_graph.pdf # plot of spot neighbor graph
│ └── stp_plots
│ ├── celltype0_program_0_top_5_genes.pdf # plot of top genes contributing to spatial program X
│ ├── celltype0_program_1_top_5_genes.pdf
│ ├── celltype0_program_2_top_5_genes.pdf
│ ├── celltype0_program_3_top_5_genes.pdf
│ ├── celltype0_program_4_top_5_genes.pdf
│ ├── celltype0_stp.pdf # plot of spatial program X
│ ├── celltype1_program_0_top_5_genes.pdf
│ ├── celltype1_program_1_top_5_genes.pdf
│ ├── celltype1_program_2_top_5_genes.pdf
│ ├── celltype1_program_3_top_5_genes.pdf
│ ├── celltype1_program_4_top_5_genes.pdf
│ ├── celltype1_stp.pdf
│ ├── celltype2_program_0_top_5_genes.pdf
│ ├── celltype2_program_1_top_5_genes.pdf
│ ├── celltype2_program_2_top_5_genes.pdf
│ ├── celltype2_program_3_top_5_genes.pdf
│ ├── celltype2_program_4_top_5_genes.pdf
│ ├── celltype2_stp.pdf
│ ├── celltype3_program_0_top_5_genes.pdf
│ ├── celltype3_program_1_top_5_genes.pdf
│ ├── celltype3_program_2_top_5_genes.pdf
│ ├── celltype3_program_3_top_5_genes.pdf
│ ├── celltype3_program_4_top_5_genes.pdf
│ ├── celltype3_stp.pdf
│ ├── celltype4_program_0_top_5_genes.pdf
│ ├── celltype4_program_1_top_5_genes.pdf
│ ├── celltype4_program_2_top_5_genes.pdf
│ ├── celltype4_program_3_top_5_genes.pdf
│ ├── celltype4_program_4_top_5_genes.pdf
│ ├── celltype4_stp.pdf
│ └── stp_loss.pdf
└── versions.yml
Example Plots
Here’s some examples of what the plots will look like:
cell_num_scatterpie
cell_type_counts
cell_type_probabilities
marker_genes
rank_genes_groups
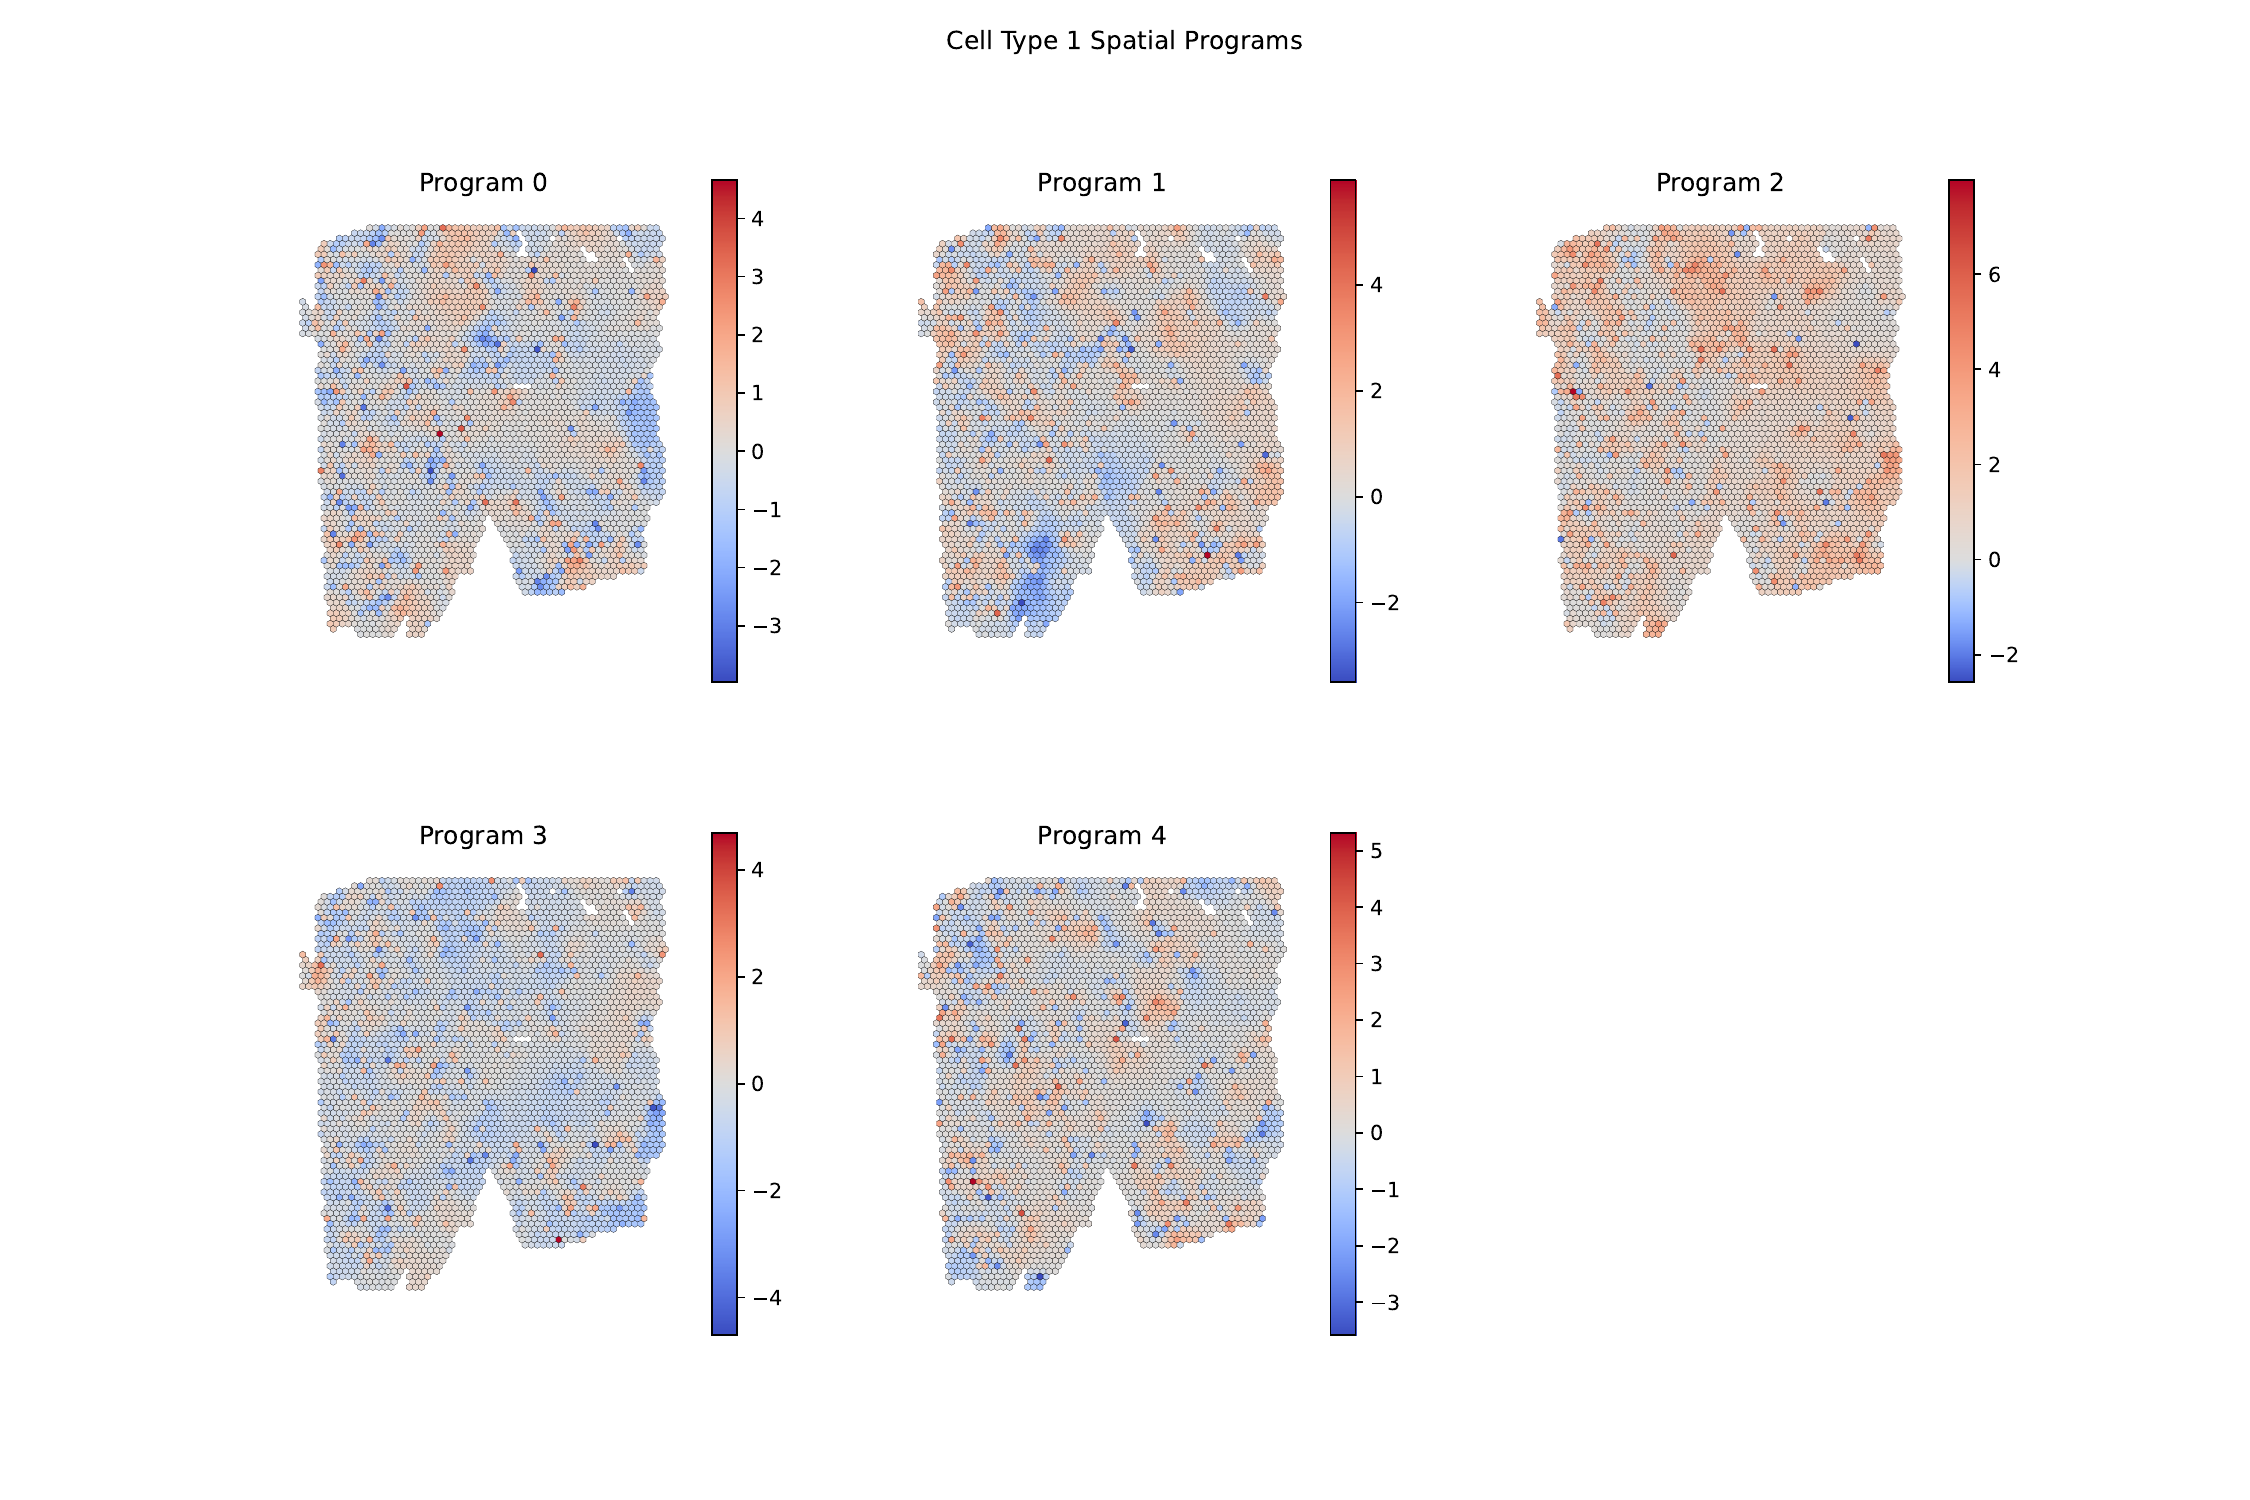
stp program
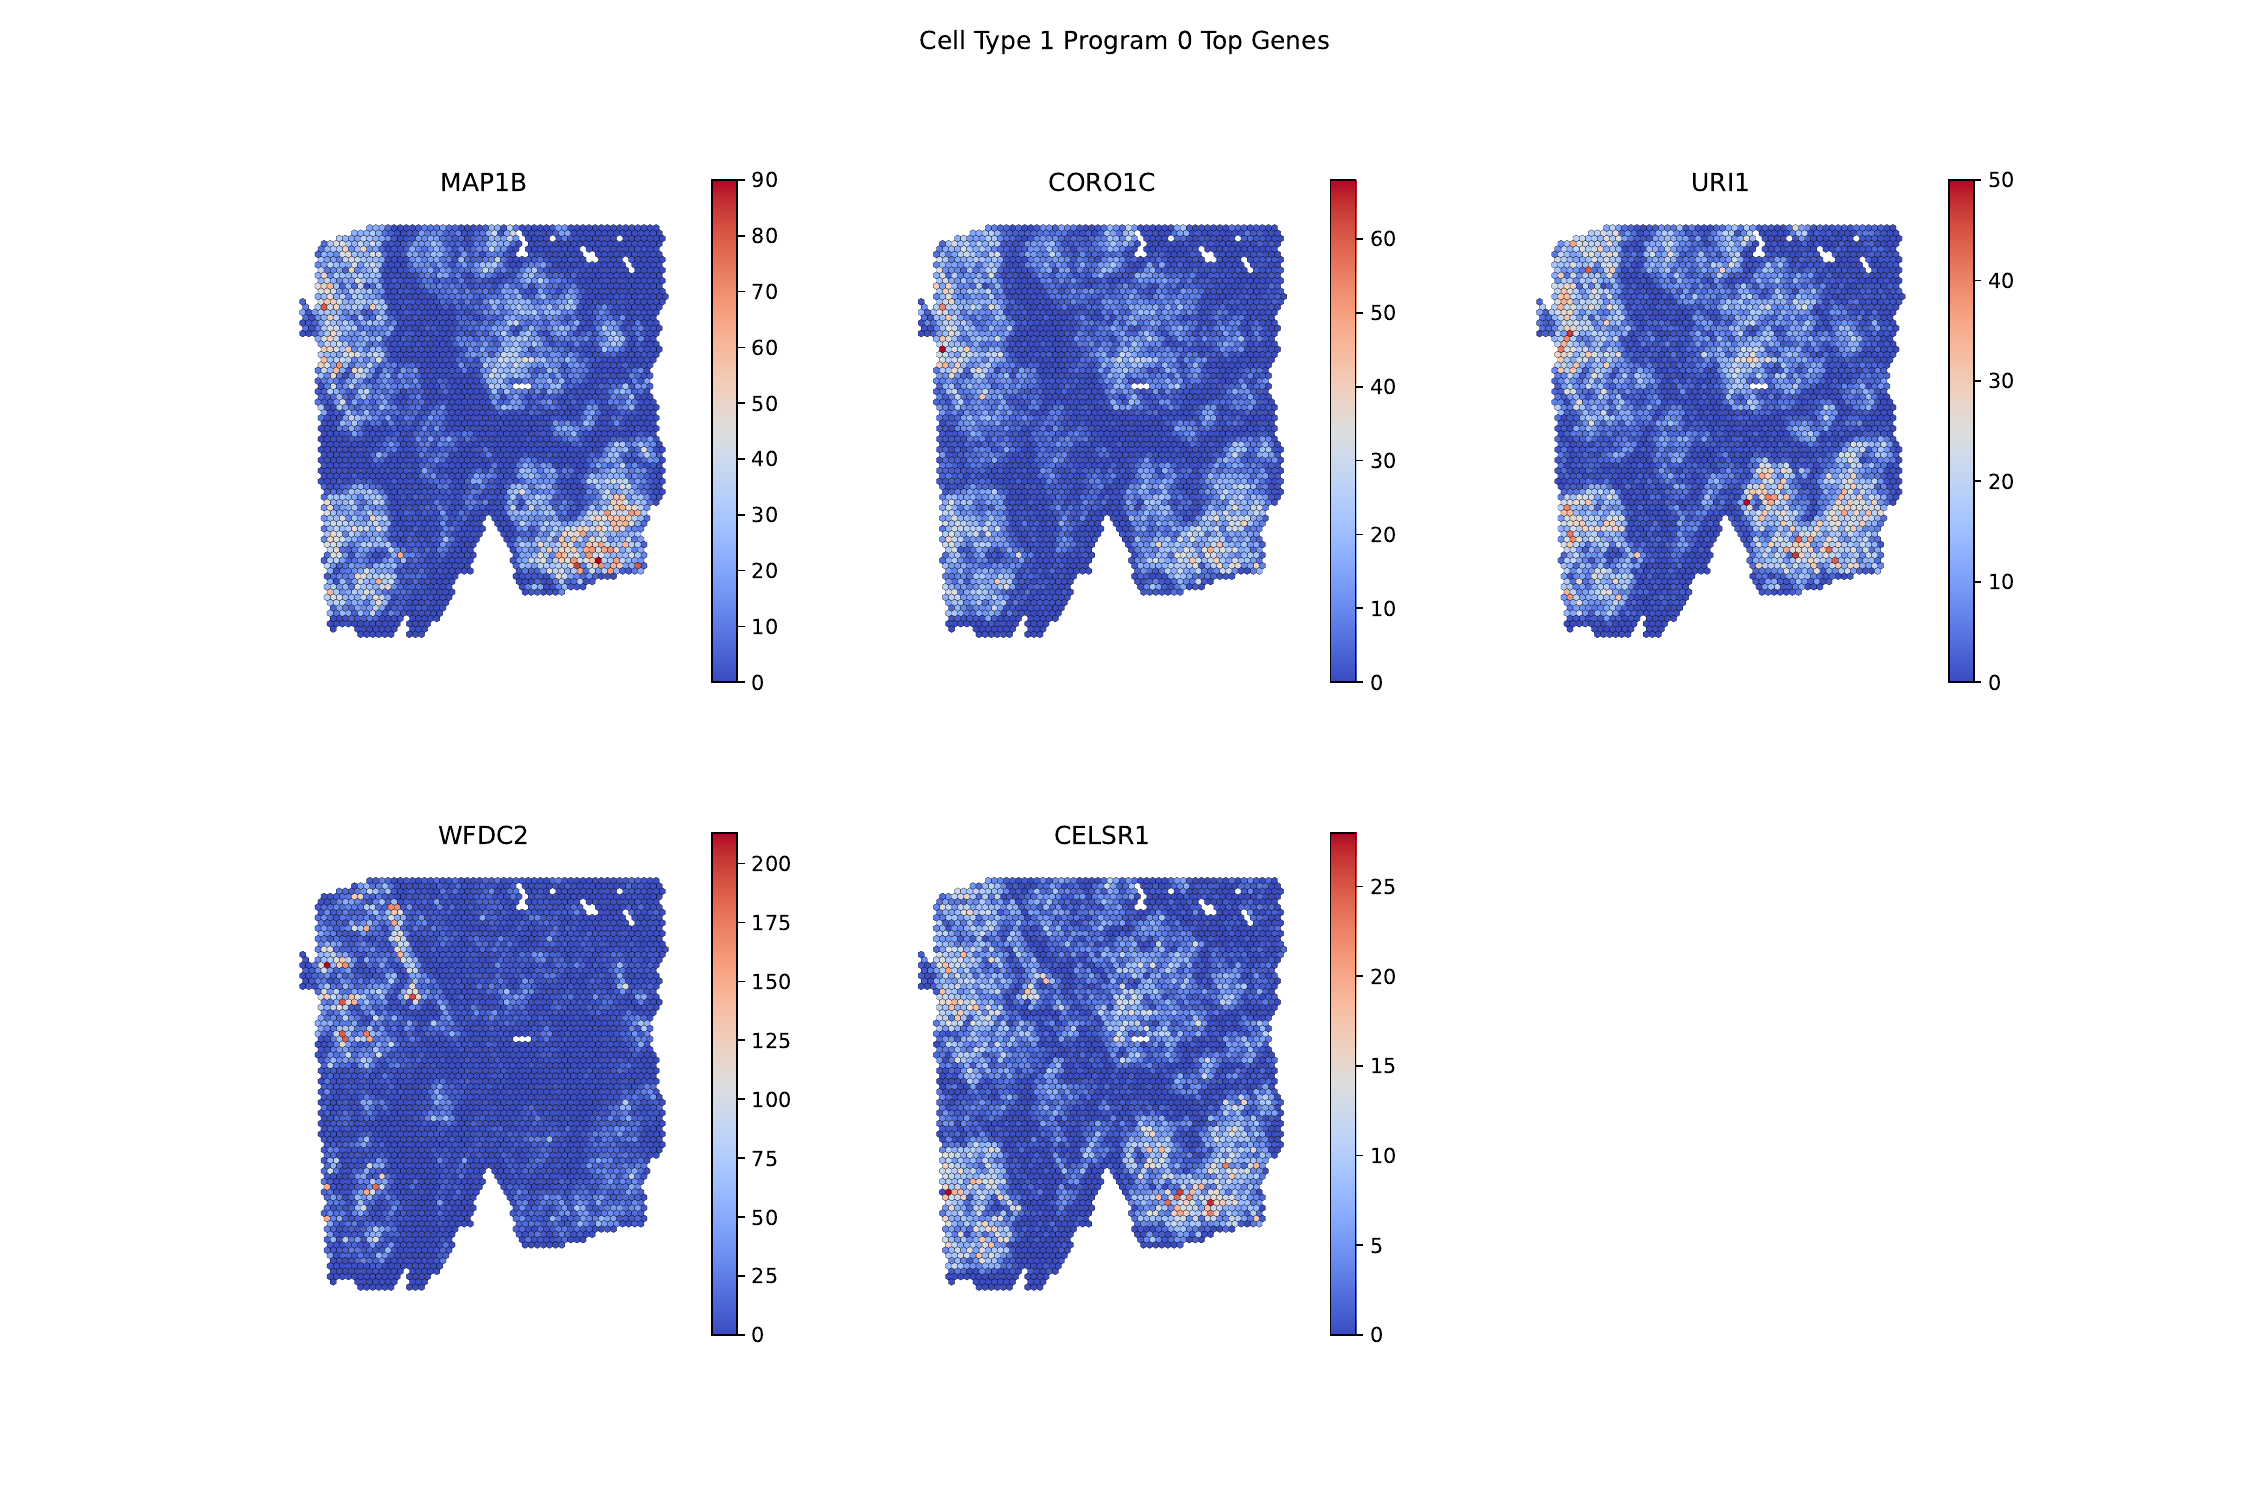
stp top genes